A bad production quality issue can spread fast. In early 2026, US recall news included food contamination concerns like possible E. coli in ground beef, and glass found in frozen chicken fried rice. Some recalls were Class I, meaning they pose a high risk of serious illness.
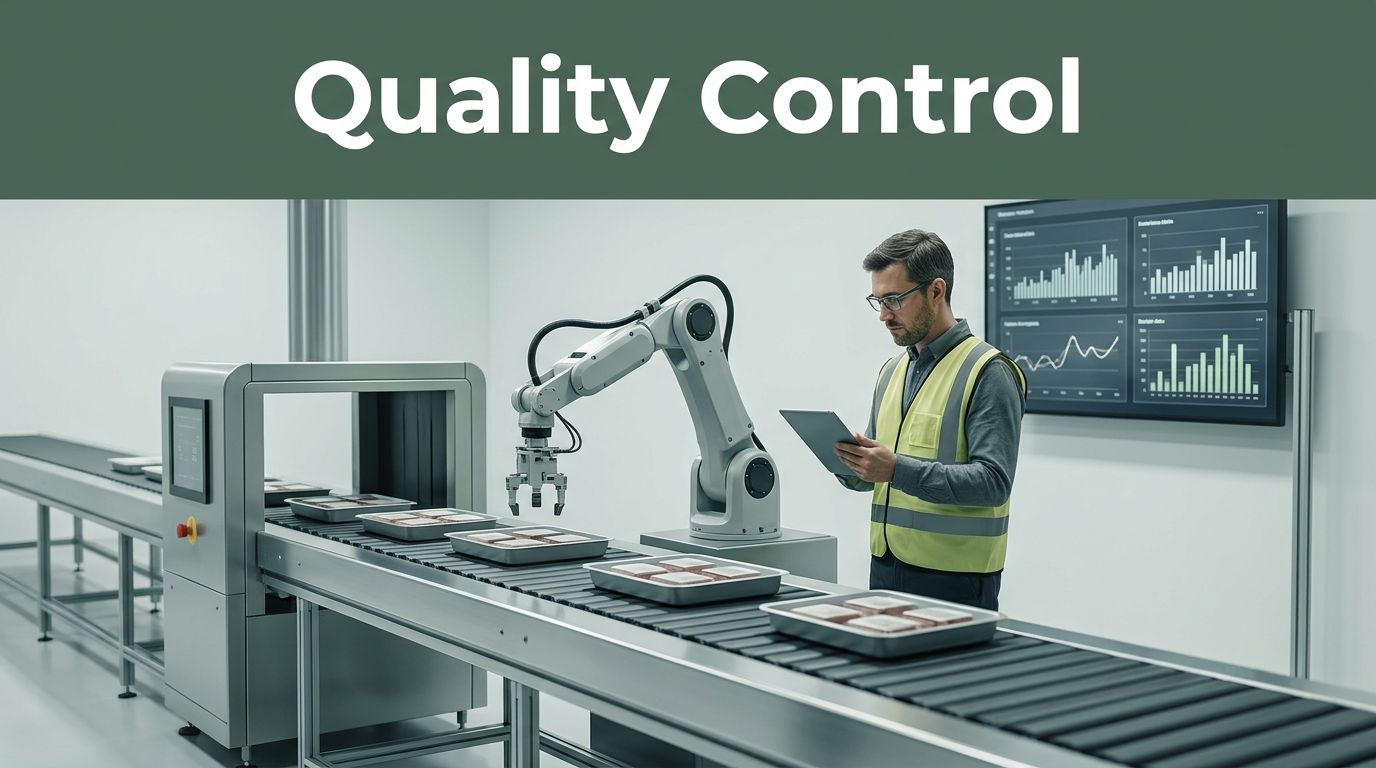
That’s a scary headline, but it also shows the real point: quality control isn’t paperwork. It prevents costly waste, protects customers, and keeps production running. In March 2026, many factories use AI and data tools to catch problems sooner and reduce rework.
So how does quality stay consistent once the line is rolling? The answer comes down to smart planning, real-time checks, worker training, and steady improvement.
Planning Ahead to Spot and Stop Quality Risks
Quality is easiest to protect before you build anything. When you plan well, you can remove weak spots in design, materials, and process steps. Otherwise, defects show up later, when fixing them costs more.
Most teams start by treating quality like a set of risks you can map. That mindset helps you set clear baselines, define targets, and make sure parts and processes stay stable. It also supports supply chain visibility, so you’re not surprised by bad batches or late deliveries.
For a simple analogy, think of it like checking your route before a road trip. You can still hit traffic, but planning cuts the chance of getting stuck for hours.
The goal is not “zero defects forever.” The goal is to reduce defect risk before production ever begins.
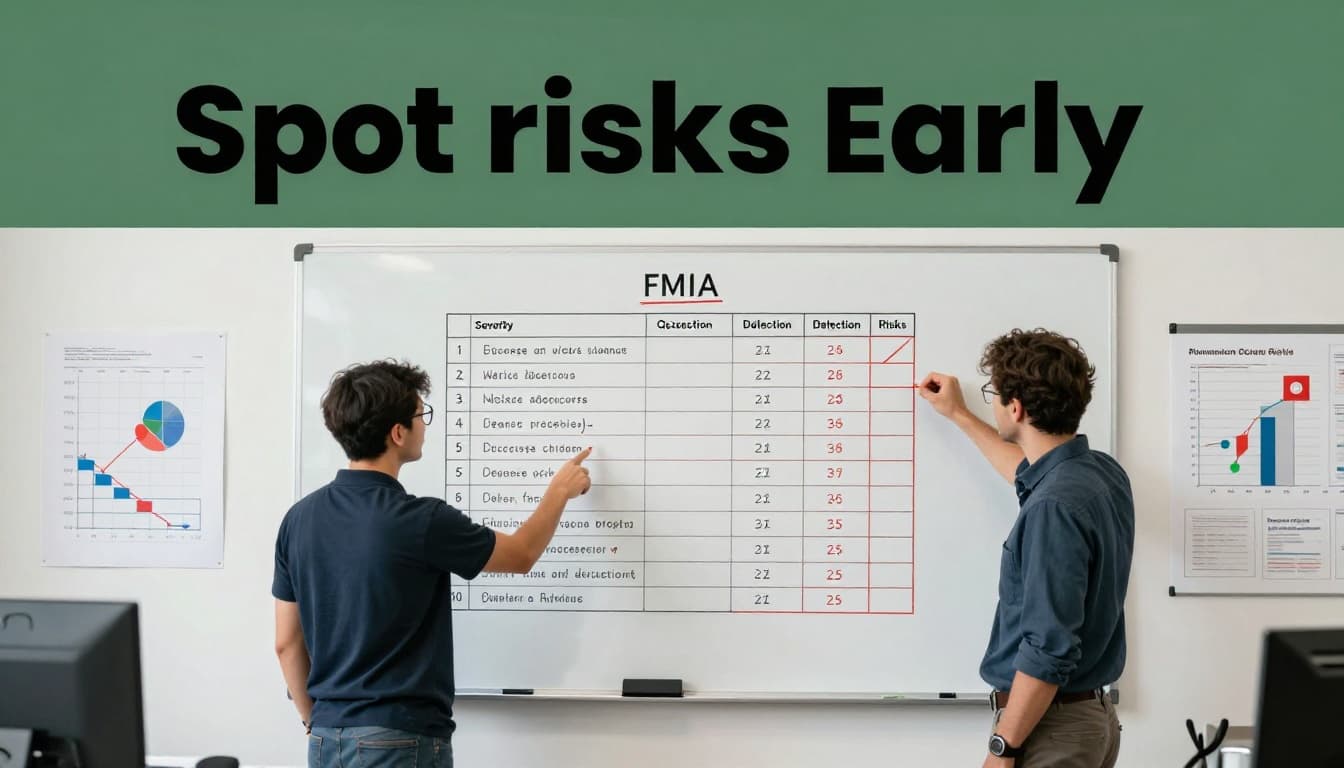
How FMEA Finds Problems Before They Happen
Failure Mode and Effects Analysis (FMEA) helps teams answer a tough question: What could go wrong, and what would it cause? Instead of guessing, you review each step of the process and list possible failure modes.
Here’s a plain, practical way to run it:
- List process steps (example: soldering, curing, packaging).
- Identify what could fail at each step (example: weak solder joints).
- Describe the effect on the next step and on the final product.
- Score each risk using three factors: severity, occurrence, and detection.
- Prioritize fixes based on the highest risk scores.
- Update the process with controls, then review results later.
You can do this for food, cars, electronics, medical parts, and more. FMEA works across industries because it forces clarity about causes and impacts. In 2026, AI helps by suggesting patterns from past defects, so teams spend less time staring at blank sheets.
If you want a structured reference, see AIAG’s FMEA overview for how companies think about FMEA tools (FMEA/DFMEA/PFMEA).
Key Metrics That Guide Your Quality Goals
Planning is only useful if you measure outcomes. That’s where quality metrics come in. They help you spot trends early, not after customers complain.
A few common metrics show up in many plants:
| Metric | What it tells you | What to watch for |
|---|---|---|
| Defect rate | Bad items per batch | Spikes after setup changes |
| Scrap rate | Wasted material % | More scrap means higher cost |
| OEE | How well machines make good parts | Drops from downtime or low speed |
| On-time delivery | % orders shipped when promised | Late shipments often hide process issues |
OEE matters because it connects equipment and product quality. Based on the typical OEE idea, you’re looking at Availability x Performance x Quality. When OEE drops, it’s usually tied to downtime, speed loss, or bad output.
You can track these with simple charts, even if you don’t have fancy software. Teams usually review them daily at shift handoff, then dig deeper weekly.
Also, remember the supply chain link. If supplier parts vary, your defect rate often rises. That’s why supply chain visibility with AI and analytics shows up in quality plans for many 2026 operations.
Real-Time Tools That Catch Issues as They Arise
Even great planning can’t stop every surprise. Materials shift, machines drift, and operators face real-time pressures. That’s why modern quality systems focus on what happens during production.
The best setups catch variation early, then correct the cause fast. They also reduce the time between “something’s off” and “we fixed it.”
In practice, this often means statistical checks, automated inspections, and dashboards that tie test results to process signals.
Statistical Process Control Keeps Processes Steady
Statistical Process Control (SPC) is one of the most proven ways to maintain quality during production. Instead of checking only the final product, SPC monitors the process while it runs.
Control charts help you see if results drift from normal patterns. When a process stays in control, variation is normal. When it goes out of control, something changed, such as a machine wear point, a wrong setting, or a material batch difference.
For example, a bottle filling line might start overfilling slightly. If inspectors only look at the last tray, the issue might grow. With SPC, the chart can flag the shift early. That gives you time to correct settings and avoid wasting full runs.
If you want a simple guide with examples, use SPC concepts and examples as a reference for control charts and variation.
SPC also supports faster decisions. Instead of debating “was that batch bad,” teams can point to the chart and act.
AI-Powered Inspections for Lightning-Fast Checks
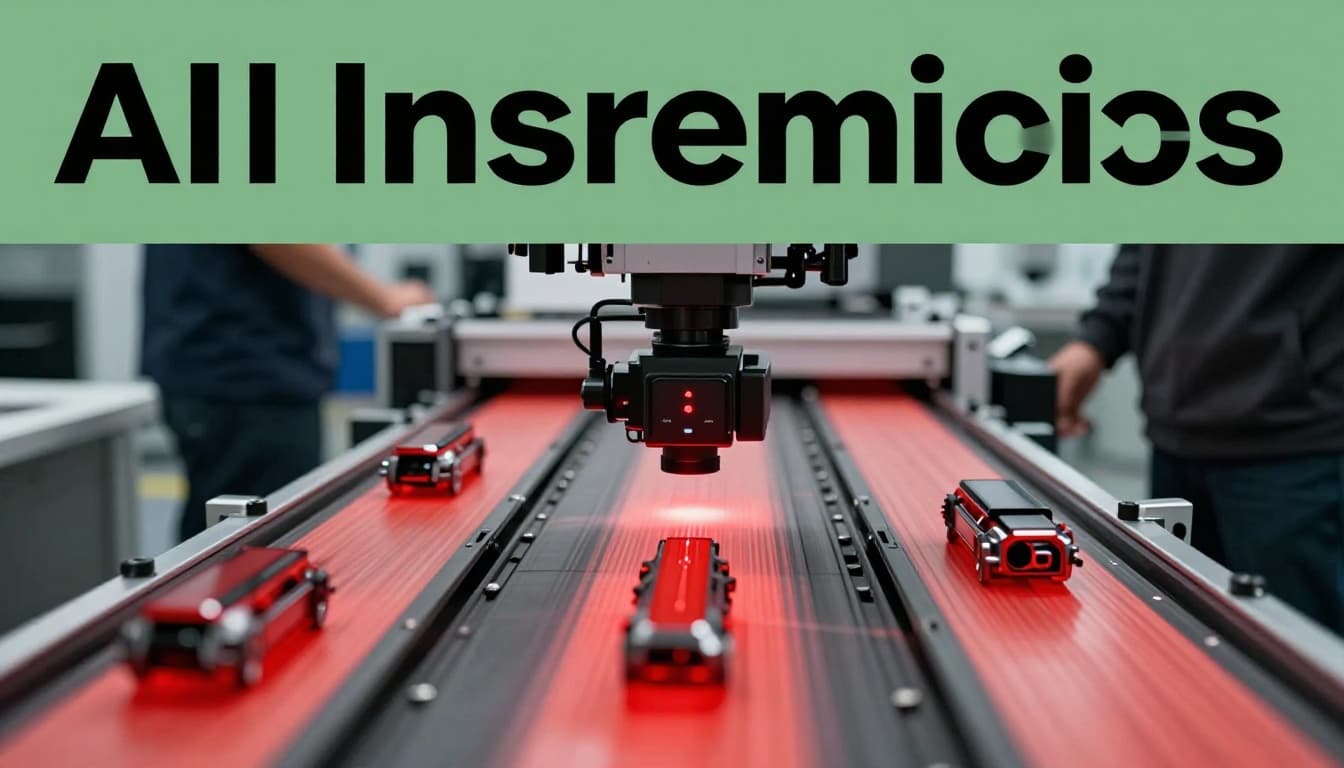
Humans are good at judgment, but they can miss tiny flaws at speed. AI inspection tools improve what people can catch in limited time.
In a typical setup, machine vision cameras scan parts moving on a conveyor. AI models then flag defects such as surface scratches, missing features, misalignment, or wrong textures. Since AI can scan quickly, it supports 100% or near 100% inspection in some lines.
A key advantage is speed. It takes less time to find a defect, so the line can stop sooner or adjust settings before more bad parts pile up.
Just as important, AI helps create an insight loop. When defects rise, teams can connect the pattern to a cause, such as:
- a tooling wear window,
- a calibration drift,
- or a process jam.
Here’s where it saves money during a shift. The quicker you catch the first signs, the fewer hours you spend on rework after the fact.
For a deeper look at how AI-based inspection is used, check AI vision inspection for real-time quality control.
Dashboards That Unite All Your Data
Real-time quality doesn’t come from one tool. It comes from linking signals.
Dashboards help teams blend machine data, test results, and quality checks. When everything connects, you can see cause and effect faster. For example, a dashboard might show that a machine slowdown happened right before defect spikes.
That matters because root cause work goes smoother. Instead of hunting through logs for hours, teams get a short list of likely causes.
A good dashboard also supports alerts. When metrics move out of expected ranges, it can notify the right role. That keeps errors from spreading into later steps and packaging.
Finally, dashboards help across shifts. The night team can see what changed during the day. As a result, the next shift doesn’t repeat the same mistakes.

Training Teams to Own Quality Every Day
Machines and software matter, but people run the system. If operators don’t understand the checks, quality breaks down in small ways. Those small gaps add up fast.
In March 2026, training needs to cover both new tools and new ways of thinking. Many plants upskill workers in data use, AI-assisted workflows, and basic maintenance for tech-ops roles.
Also, quality improves when teams can communicate across departments. Maintenance, quality engineering, operators, and supply chain teams often have different views. Cross-team learning helps them move in the same direction.
Upskilling for the AI Factory Era
Training shouldn’t be a one-time video. It works best as hands-on practice tied to your real line.
Common upskilling topics include:
- How to read SPC charts and understand “out of control.”
- How to respond to AI inspection flags (what to check first).
- How to log defect notes so the next analysis is better.
- How to use maintenance data to spot wear patterns early.
A practical way to build this is to run short “learning loops” on the floor. For example, you can train a small group on the week’s main quality risk. Then you review results after a shift or two.
That approach matches what many factories see. The workforce gap is real, and training plus hiring can help close it. For context on how AI in manufacturing ties into job openings and workforce needs, see AI’s role in manufacturing employment.

Cross-Team Groups Spark New Ideas
Quality gets better when people share ideas and test changes safely. That often means forming small cross-team groups.
For example, a group might include:
- an operator from the line,
- a quality engineer,
- a maintenance lead,
- and someone who owns data or systems.
Then the group tests a change with clear limits. Maybe they adjust a parameter for one product run. Maybe they add a check step before a rework station. Next, they compare results using metrics like defect rate and scrap rate.
Because the group includes multiple viewpoints, they catch hidden causes. The operator sees what happens at speed. Maintenance spots tool drift. Quality engineering checks how the process should behave. Data folks make sure the signals are trustworthy.
The payoff is faster improvement with fewer false starts.
Continuous Tweaks for Ever-Better Quality
Quality maintenance is never “done.” However, it also shouldn’t turn into constant change without direction.
A strong system uses improvement methods that connect back to data. You also need to keep your tech stack secure, because production systems depend on access controls and safe permissions.
Most teams end up with a simple rhythm:
- maintain control,
- improve the weak points,
- and prevent the same issue from coming back.
Start with Solid Data Before Fancy Tech
AI and automation can help, but only if the inputs are clean. If your sensors are wrong, your charts become noise. If your labeling is inconsistent, your defect root cause work stalls.
So start with data quality. Check that:
- measurements are accurate,
- test results match the right product lots,
- timestamps align across systems,
- and missing values don’t hide real problems.
This is the order that prevents failures. First, fix the basics. Then connect systems. Then add AI to predict and speed up decisions.
If you skip the order, you might “automate” a bad process. That creates more waste, not less.
Smart Goals and Speedy Testing Loops
Set goals that are clear and realistic. “Improve quality” is too vague. “Reduce scrap rate by X over 60 days” is more actionable.
Also, aim for “good enough” targets. Then test changes in short loops. This builds momentum without causing chaos.
A simple method is parallel testing during low-risk windows. For example, you can add an extra check during a safety review, then compare defect counts. If it works, roll it out more broadly.
Finally, prevent over-fixing. If a defect is rare but extremely expensive, you might focus on that first. On the other hand, if many small defects add up, improve the highest-volume process step first.
Over time, this makes quality feel steady, not fragile.
Conclusion
Quality stays consistent when you treat it like a system. You plan ahead with tools like FMEA, you track the right metrics, and you act on risk early. During production, SPC, AI inspections, and unified dashboards help you spot issues fast and correct them before they spread.
Then you make it stick with training. Teams that understand the controls and the “why” own quality every day. In 2026, that edge comes from combining AI with solid data and real people on the floor.
If that recall story at the start made you pause, start small today. Pick one process, review your quality data, and add SPC charts for the next shift. What you catch early can save you from bigger costs later.